 Penstock
Guide / Test and run
Monitor
Monitor shows what the engine is doing with this diagram right now: how many instances wait at each step, where the incidents are, what an expression gives on a real instance, and which variable names the model and the engine disagree on. It also looks back at finished instances, and starts, cancels, retries and messages instances when you ask.
Read it
- Deploy the process, so the engine has it. See Deployment.
- Press Monitor on the toolbar, or pick the Monitor tab of the sidebar. With no engine set up it says No engine connected. and offers Set up connection….
- Penstock asks the engine of the profile in force. The tab names the engine and the version of each process it found, so you can tell whether you are looking at what you think you are.
- Look at the diagram. Badges on the shapes show how many instances wait there, and how many have an incident.
- Press Refresh to ask again.
Where Monitor is available
JetBrains
Monitor is the fourth tab of the sidebar, and the toolbar button opens it. Go to code on an incident opens the worker in the IDE.
VS Code
Monitor is a tab of the sidebar, and the toolbar button, or Penstock: Monitor, opens it. It asks the engine of the profile in force. Go to code on an incident goes through the code links, so with Pro a job type opens its worker. See Code links in VS Code.
Command line
Not available on the command line. Monitor needs a picture of the diagram. To look at an instance from a terminal, use the tools of your engine.
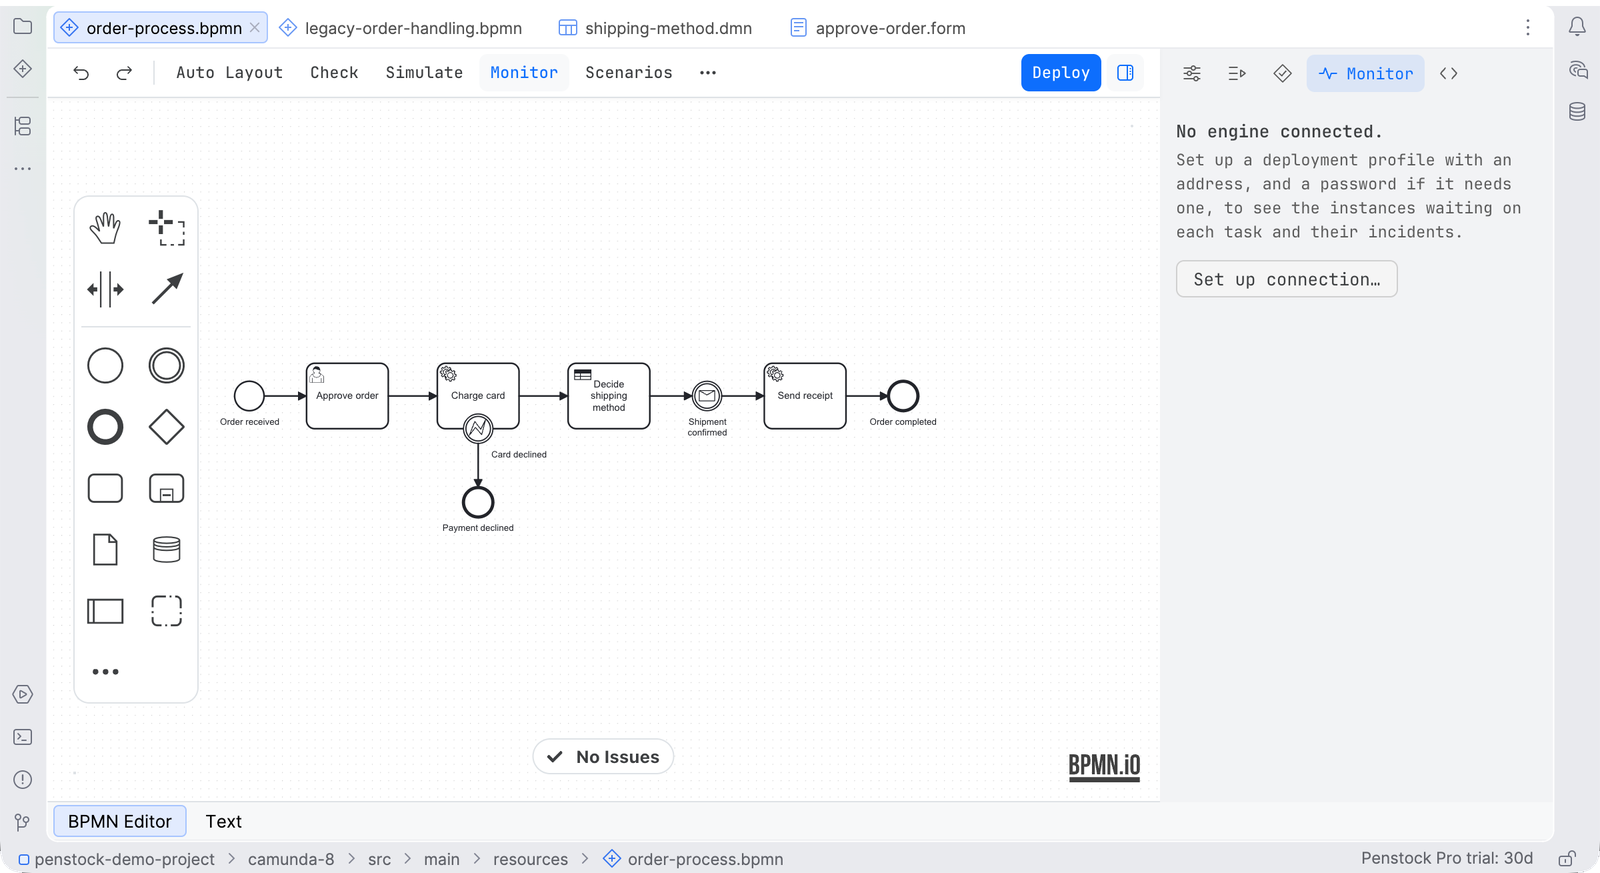
What you see
| Incidents | Each incident with the step and the message the engine gave. Click one to select the step. Go to code opens the worker that runs the task, when Pro links code to the diagram. |
| Waiting | Each step with instances waiting on it, and how many. |
| Instance | The running instances of the process, each with its business key or its id, the time it started and its state. Use picks one for the sections below, Cancel instance ends it and Open in Tasklist shows it there. |
| User tasks | With an instance picked: the user tasks waiting on it, each with its form. See Complete a waiting user task. |
| History | The last finished and cancelled instances. See Instances that are over. |
| Badges | On the canvas: how many wait at each step, and how many have an incident, so a busy step is visible without opening the tab. |
| Hover | The hover card of an element says what waits on it. |
Other messages: No instance of order-process is running on prod., Nothing is waiting or has an incident on prod. and order-process is not deployed. followed by It is not on prod yet. Deploy the diagram to see its instances. The tab says which address was asked and when, and The engine could not be read. when it got no answer.
Heat map, replay and incidents
- Choose a period in the tab and the diagram is painted by how often, how long and how badly each element ran. Pro See Heat map and replay.
- Replay this instance in the History section steps through a real instance with its variables, and What if from this token starts a new one on a test engine. Pro
- Reproduce as scenario on an incident builds a scenario that reproduces it, and Fix end to end… runs the loop from reproduce to retry. Previewing the scenario is free; the rest is Pro. See Incident to fix.
Instances that are over
The History section lists the last ten instances of the process that finished or were cancelled, newest first. Each row gives the business key or the id, the time it started and the time it ended, how long it took and its state, completed or canceled. It works on Camunda 7 and Camunda 8.
- Click a row. The path that instance took is drawn on the diagram: the steps it passed, coloured by how they ended, and the flows between them.
- Click the row again to clear the path.
- Open the Timeline to see the same instance against time. A row picked here is the run the timeline shows.
With nothing to show, the section says No finished instances found. and Instances that completed or were cancelled will appear here. The instances are read from the history of the engine, and an engine that keeps no history has none to list.
Complete a waiting user task
Pick a running instance with Use. The User tasks section lists the user tasks that wait on it, with the task id and the assignee. Select one and its form appears in the tab, as the engine has it deployed. Fill it in and press Complete. What you type becomes the variables of the task. A task with no form has a Complete button alone. The tab says Task completed., or why it could not, as in Unable to complete user task.
This works on Camunda 7 and Camunda 8, on the engine of the profile in force. It is an action you ask for: the engine is changed when you press Complete and not before.
Start an instance
- Press Start instance… at the top of the tab, or choose it in the More menu or the command palette.
- The Process ID is filled in with the process of the diagram. Change it to start another one.
- Type the Variables (JSON), a JSON object such as
{"orderId": "A-1001"}. The field says Variables should be valid JSON or Variables should be a JSON object until it is. - Press Start instance. Penstock says Started instance with its id, and the tab reads the engine again.
It works on Camunda 7 and Camunda 8. The process has to be deployed first. See Deployment.
Act on an instance
Beside the instances and the incidents there are buttons for what you would otherwise do in the engine's own web app. Each one asks the engine of the profile in force, and each one changes something there, so each one runs only when you press it.
| Retry | On an incident: tries the failed step again. Camunda 8 only. The button is on the incident row. |
| Cancel instance | On an instance, or on an incident's instance. Asks Cancel process instance …? first, and does nothing if you decline. Camunda 7 and Camunda 8. |
| Send message | Publishes a message. Give the Message name, a Correlation key if the receiver has one, and Variables (JSON) if it should carry any, then press Send. Camunda 7 and Camunda 8. |
| Broadcast signal | Broadcasts a signal to everything that waits for it. Give the Signal name and optional Variables (JSON), then press Broadcast. Camunda 7 and Camunda 8. |
If the engine refuses, the reason is written under the button, as in Unable to retry incident, Unable to cancel instance, Unable to send message or Unable to broadcast signal. After an action that worked, the tab reads the engine again.
Open in Tasklist
Open in Tasklist opens the engine's Tasklist in your browser. At the top of the tab it opens Tasklist itself. On an instance it opens that instance, and on a waiting user task, a link to that task. It is also in the More menu and the command palette. It works on Camunda 7 and Camunda 8 when the profile has an address. On Camunda 8 SaaS the link is the Tasklist address of the cluster's region, and for a Camunda 8 you run yourself it is the /tasklist of the engine's address.
Try an expression on a real instance
- Pick an instance in the Monitor tab: press Use on it, or on the one an incident names. Then select a task, a gateway or a flow in the diagram. Until you do, the tab says Select a task, a gateway or a flow to try its conditions and mappings on the instance.
- Every condition, input and output mapping and script on it can be run against that instance's variables with Try. The result, or the engine's own complaint, appears next to the expression. Read the variables shows the variables of the instance.
- The same action is on the expression field in the properties panel, where the result lands under the field.
Nothing is written on the engine. On Camunda 8.9 and later the engine evaluates the expression. Camunda 7, Operaton and CIB seven cannot evaluate an expression on request, so the tab shows the instance's variables and says what evaluation needs. Penstock does not evaluate an expression locally: a local answer would not be the engine's answer. A camunda.secrets reference shows the placeholder the engine returns, and Penstock does not resolve the secret.
Variable names the model and the engine disagree on
On Camunda 8.10 and later the engine can list the variable names it has seen for the deployed definition. Compared with what the diagram reads and writes, that gives two short lists.
- Unused in the model. The engine has seen the name and nothing in the diagram names it.
- Never set in production. The diagram reads the name and the engine has never seen it. The elements that read it are listed, and a click selects one.
Press Compare with what the engine has seen to ask. When the two agree, the tab says The model and the engine agree on every variable name. The comparison is with the diagram, not with the code. A variable that only the code reads is still unused in the model. The Code tab is where the two are compared.
| Camunda 8.10+ | Camunda 8.9 | Camunda 8 before 8.9 | Camunda 7, Operaton, CIB seven | |
|---|---|---|---|---|
| Instances and their variables | yes | yes | yes | yes |
| Evaluate an expression | yes | yes | needs 8.9 | needs 8.9 |
| Variable names the engine has seen | yes | needs 8.10 | needs 8.10 | not offered |
The version is never guessed. Penstock asks, and when the engine has no such endpoint the tab says which version it needs.
When the engine is asked
Only when you open Monitor, press Refresh or ask for a result. Never in the background. Every question is a read, apart from the actions you press yourself: Start instance, Cancel instance, Retry, Send message, Broadcast signal and Complete on a user task. Those change the engine, and only when you press them. It works on Camunda 7, Operaton and CIB seven, and on Camunda 8.8 and later. The request is made with the profile's credentials, so the user of the profile has to be allowed to do what you ask. See Security and privacy.
Common problems
- The tab says no engine is connected.
- The profile in force has no address. Press the arrow next to Deploy and choose Edit connection…. Or set
deployment.url. See Deployment. - "The engine refused the question (403)".
- The profile's user may not read process instances. Use a user that may. The same goes for an action: a user who may read may still not be allowed to cancel, retry or start.
- There is no Retry on an incident.
- Retrying an incident is a Camunda 8 action. On Camunda 7, fix the cause and cancel the instance, or use the engine's own web app.
- There is no Send message or Broadcast signal.
- The process is not deployed on the engine of the profile in force. Deploy it first.
- "is not deployed on …".
- Deploy the process to that profile first.
- The numbers look old.
- Press Refresh. Monitor does not update by itself.